Service
Dashboards & Reporting
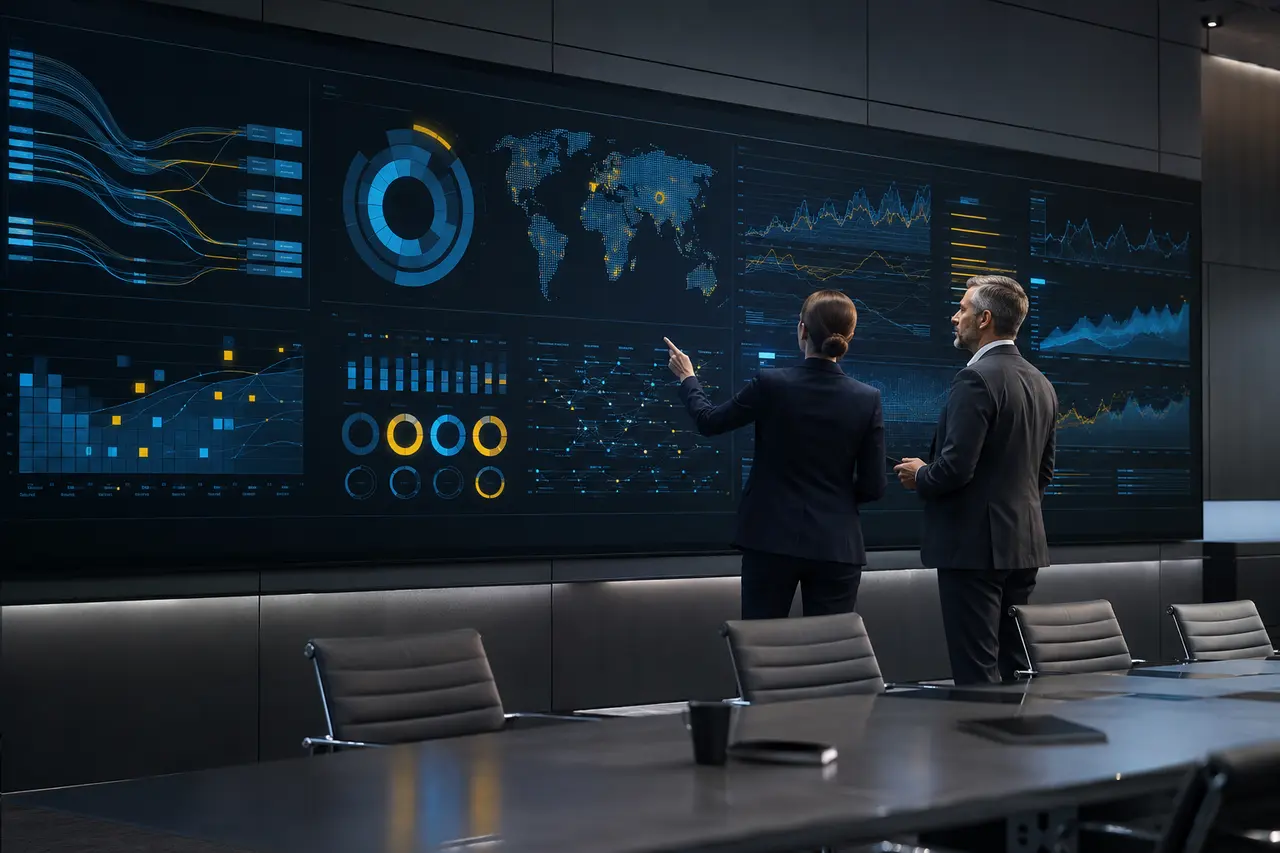
A good dashboard changes how a business is run. We build sales dashboards, job profitability dashboards, operations control panels, financial snapshots, retention dashboards, forecasting views, and executive KPI dashboards — each designed around the decisions its owner needs to make.
The problem this solves
Why businesses call us for this
Most owners run on gut feel because assembling the real numbers takes too long. Reports are manual, late, and inconsistent — so problems are discovered after they've become expensive.
Engagement brief
What we establish before the build
Every engagement moves through clarity, system design, execution, and ongoing optimization. These are the proof points behind that sequence.
- 01
Executive KPI dashboards
Revenue, profit, pipeline, operations, staff, and customer metrics with alerts and trend analysis.
- 02
Job margin intelligence
Revenue, labor, materials, and overhead per job — with profit ranking and underperformer detection.
- 03
Expected operating result
Decisions made on current numbers, not memory · Reporting time reduced from hours to zero
- 04
Handoff standard
AI-generated plain-English summaries (optional) · Training and iteration cycle
The right first build is the one that removes the largest verified bottleneck—not the one with the most fashionable technology.
Capabilities
What dashboards & reporting includes
Executive KPI dashboards
Revenue, profit, pipeline, operations, staff, and customer metrics with alerts and trend analysis.
Operations control dashboards
Open jobs, overdue tasks, pending quotes, unpaid invoices, staff assignments, and weekly summaries.
Job margin intelligence
Revenue, labor, materials, and overhead per job — with profit ranking and underperformer detection.
Sales funnel intelligence
Source, response time, contact rate, quote rate, close rate, deal size, and forecast.
Forecasting & cash flow
Projections, scenario analysis, runway, and warning alerts from historical data.
Bottleneck & compliance dashboards
Stuck jobs, aging tickets, missed follow-ups, checklist completion, and corrective actions.
Deliverables
What you receive
- KPI definition workshop and metric dictionary
- Designed dashboard with role-based views
- Automated data feeds from your systems
- Scheduled reports and alert rules
- AI-generated plain-English summaries (optional)
- Training and iteration cycle
How it works
Our approach
- 01
Decide what matters
Metrics chosen for the decisions they inform, not for decoration.
- 02
Automate the feed
Data flows in from your systems — nobody 'updates the dashboard.'
- 03
Design for scanning
Status visible in five seconds; detail one click away.
- 04
Add intelligence
Alerts, trends, and AI summaries that interpret rather than just display.
Technologies & methods
- Custom web dashboards
- Google Sheets / Excel engines
- SQL & APIs
- Charting libraries
- AI report generation
Ideal clients
- Owners who don't know their numbers until month-end
- Managers coordinating jobs, staff, and follow-ups
- Multi-location businesses comparing performance
- Teams whose reporting day consumes a full day
Business impact
- Decisions made on current numbers, not memory
- Reporting time reduced from hours to zero
- Problems flagged while they're cheap to fix
- One shared version of the truth
Related products
Systems that pair with this
- Executive KPI Dashboard
The owner's high-level view: revenue, profit, pipeline, operations, staff, and customer metrics with trends and alerts.
- Operations Control Dashboard
The daily operations panel: open jobs, overdue tasks, pending quotes, unpaid invoices, staff assignments, and alerts.
- Business Command Center
One screen for the whole business: leads, jobs, tasks, revenue, staff workload, alerts, and AI summaries.
Related industries
Where we apply it
- Contractors & Trades
Roofers, painters, remodelers, HVAC, electricians, plumbers, handymen — stop losing leads and start tracking jobs from quote to completion.
- Logistics, Trucking & Delivery
Trucking, couriers, movers, warehousing, and dispatch-heavy operations — built by consultants who've actually worked the floor.
- Traders, Discord Trading Groups & Communities
Forex traders, prop-firm traders, educators, and signal communities — dashboards for risk, discipline, journaling, and performance.
Frequently asked questions
Ready to talk about dashboards & reporting?
Start with a consultation. We'll review how your business runs today, identify the bottlenecks worth fixing, and recommend an honest first step — whether or not it's a project with us.